
Business Intelligence Dashboard Implementation
GrayMatter’s proprietary Business Intelligence Dashboard Implementation Framework RADIUS enabled us as one of the top business intelligence companies in US offering business intelligence consulting services in US.
Get the world’s most customizable, reliable and advanced business dashboards and real-time Analytics.
> Enterprise wide analytics addressing the right KPI’s
> Flexible technology stack-Microsoft Power BI/SAP BI/ Qlik/Pentaho
> Unclutted visuals with glance-through approach
> Seamless and responsive UI with cross-device compatibility
> Flexible and cost effective
> Customer success stories across North America
Contact Us
Our Customers


![]()


Ace the Art of Storytelling through BI Dashboards. Optimize your Business Intelligence Implementation.
Collect, organize and transform your data into rich visuals.
GrayMatter as your partner has expertise in collecting, organizing and transforming your data into rich visuals so that you can focus on the KPIs driving your business. Our business intelligence services finely prepare dashboards that ensure you always remain up-to-date with the latest information, recognize trends as they happen, and push your business further by taking informed decisions. For a span of over 12 years, GrayMatter has to its credit being one of the finest developers of cost-effective, insightful and adaptable dashboards and Business intelligence services. Our BI dashboards are easy to create and provide you with massive analytical flexibility.
Our dashboard creation services include:
- Creating interactive and dynamic dashboards
- Modification and streamlining of existing dashboards as per the your request
- Dashboard consultation including Visualization best practices, successful deployment practices, KPI development, etc.
- Dashboard Training and Maintenance
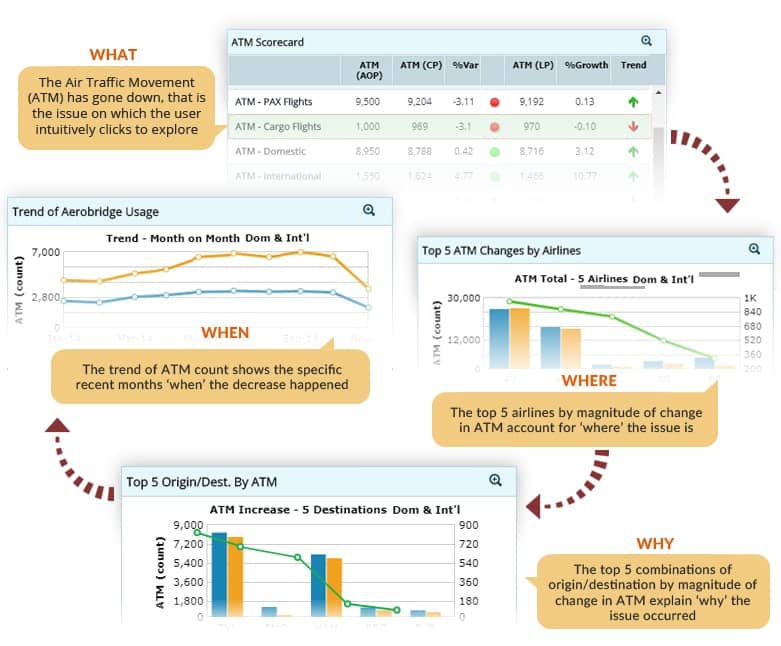
4W Approach
The business dashboards are designed in such a manner that lead the user from one question to the next and by the end of the navigation the user understands what the opportunity or issue is, where is it occurring, when is the trend observed and why is it happening. The visualizations intuitively guide the user to move from one analysis to the next, just as human mind would think.
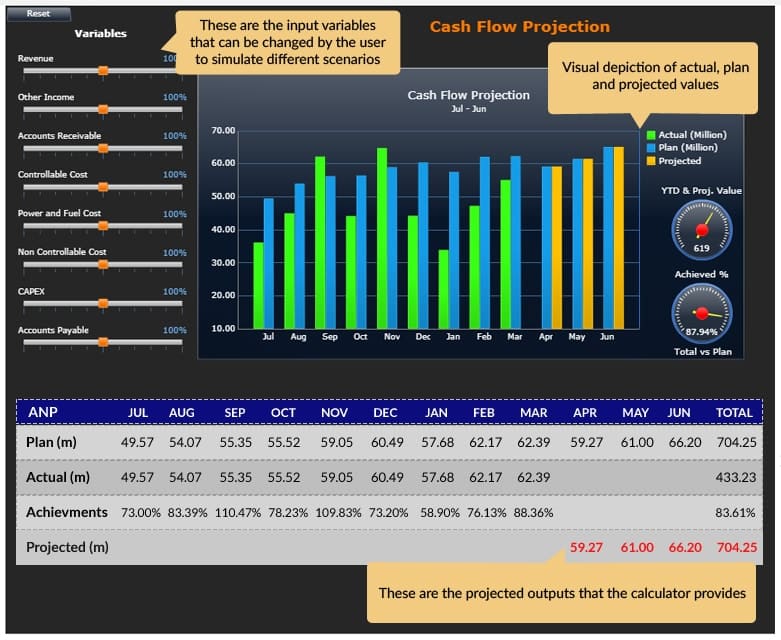
What-If Simulation
These BI dashboards and calculators are typically for business analysts to simulate various scenarios. For example, in the calculator below the user can adjust the accounts receivable, accounts payable etc. by tweaking the controls on the left side to get the projected cash flows. This is a very key aspect of business intelligence dashboard implementation services in US that enables business users to do scenario planning and analysis.
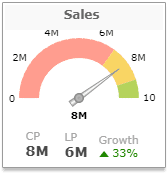
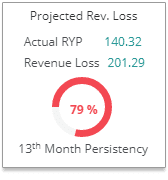
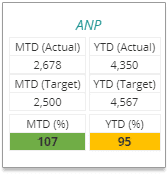
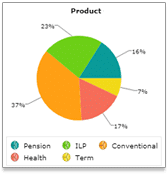
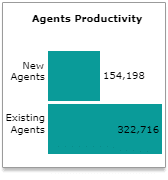
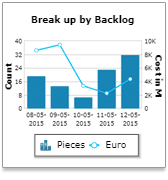
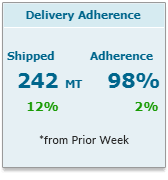
Role-Based Dashboards
Visualizations and KPI’s Delivered according to role of BI Consumer.
Airport CEO
Airport COO
CFO
Insurance Agency Head

Insurance Agent
Insurance Board
Insurance Sales Head
Insurance Unit Manager
Manufacturing Board
Manufacturing COO
Customer Testimonials
Our organization and I have been engaged with GrayMatter for the last four years and we are extremely pleased with their services and resources. With their expertise and global experience, we were able to roll-out Business Intelligence and Analytics solution worldwide for 10K users successfully.
Mr. Narayanan Palissery, Convergys
Sr. Manager, Information Security Architecture
The GrayMatter team have been of great help in implementation of the TPS billings reports , cubes and upgrading Pentaho environment to 5.0.5. The team worked through the weekend resulting in very minimum impact of downtime to business. GrayMatter has done good job in entire life cycle of the project, developing , testing and deploying in production. I have enjoyed working with them.
Mr. Rajpal Bajaj, Trimble, USA
Project Manager
© GrayMatter Software Services Pvt Ltd 2006 -2019