
Ace the Art of Storytelling through BI Dashboards
GrayMatter’s RADIUS Dashboarding Framework – changes data into stories
-
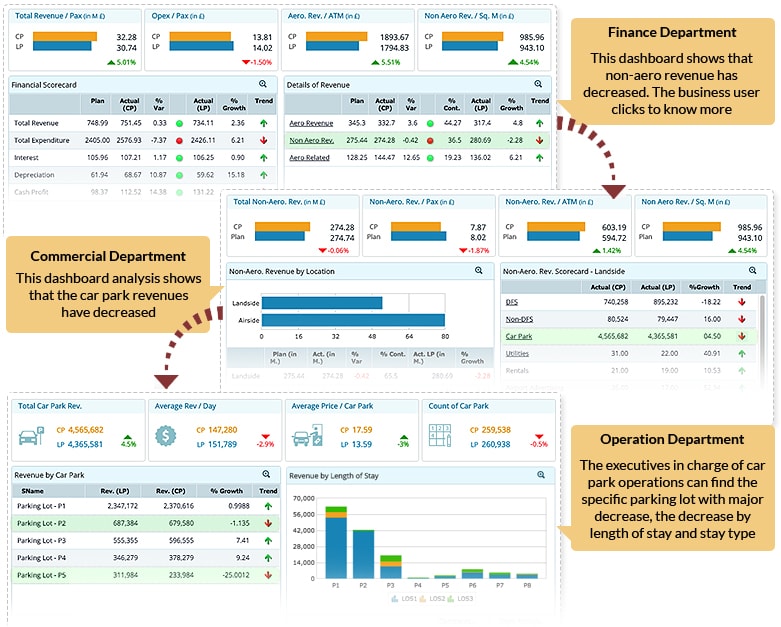
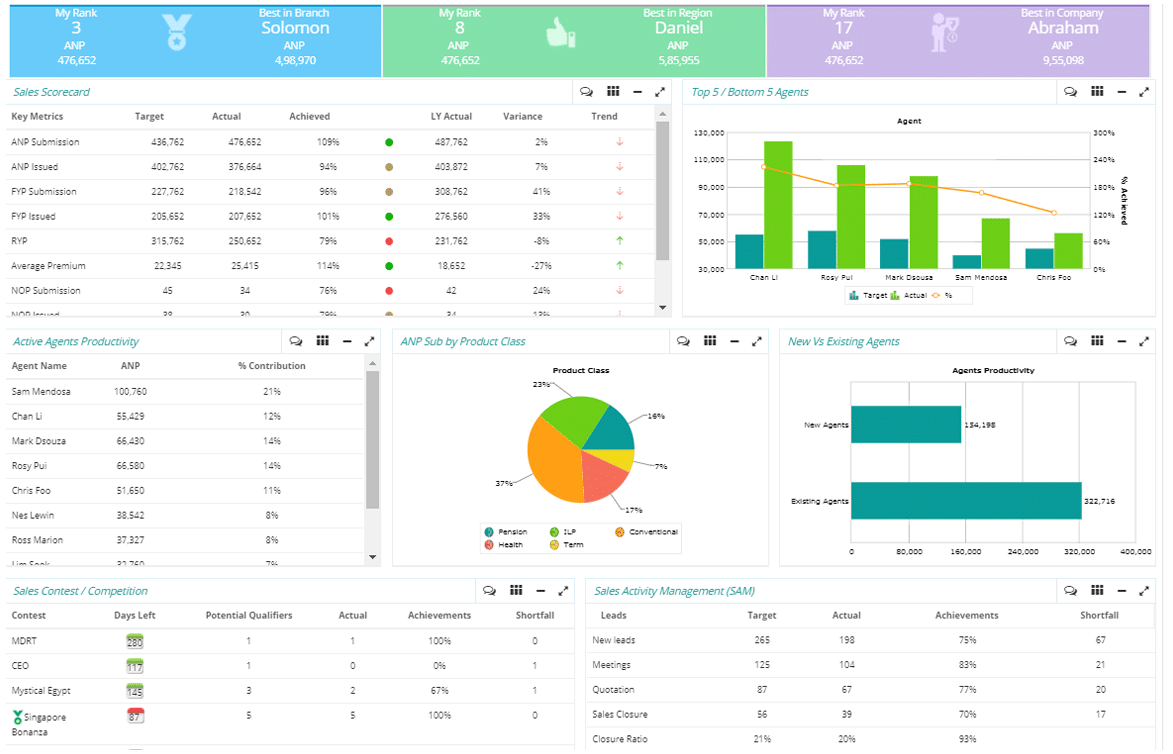
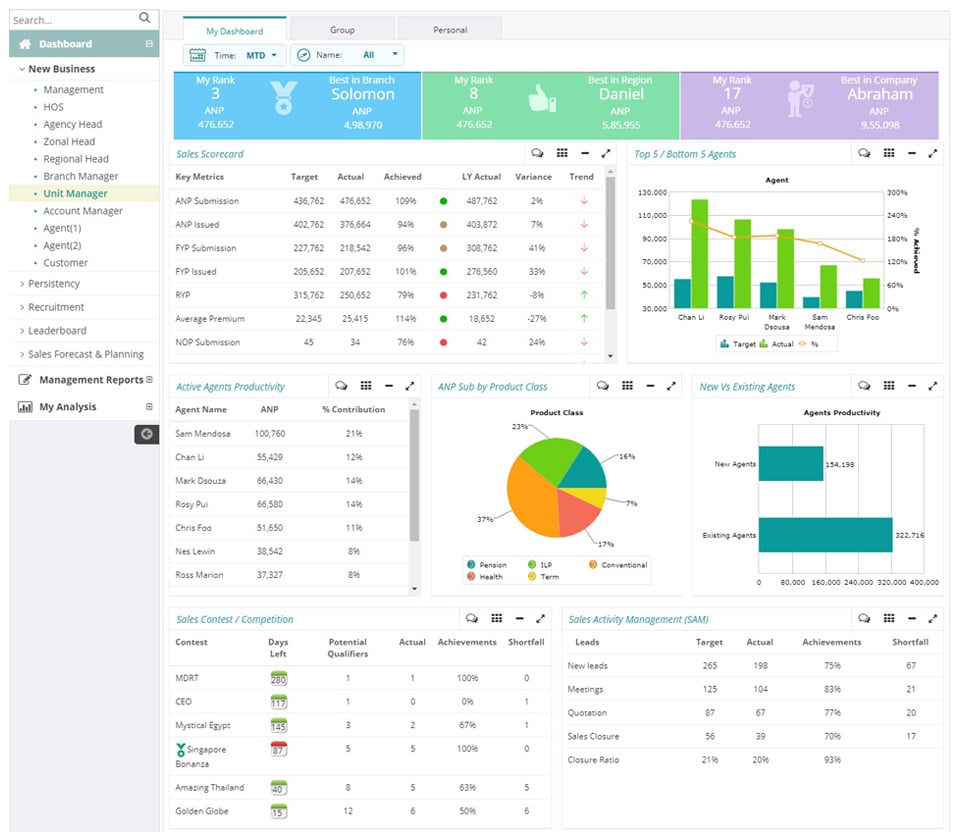
Role-Based Dashboards
-
Addressing the right KPIs
-
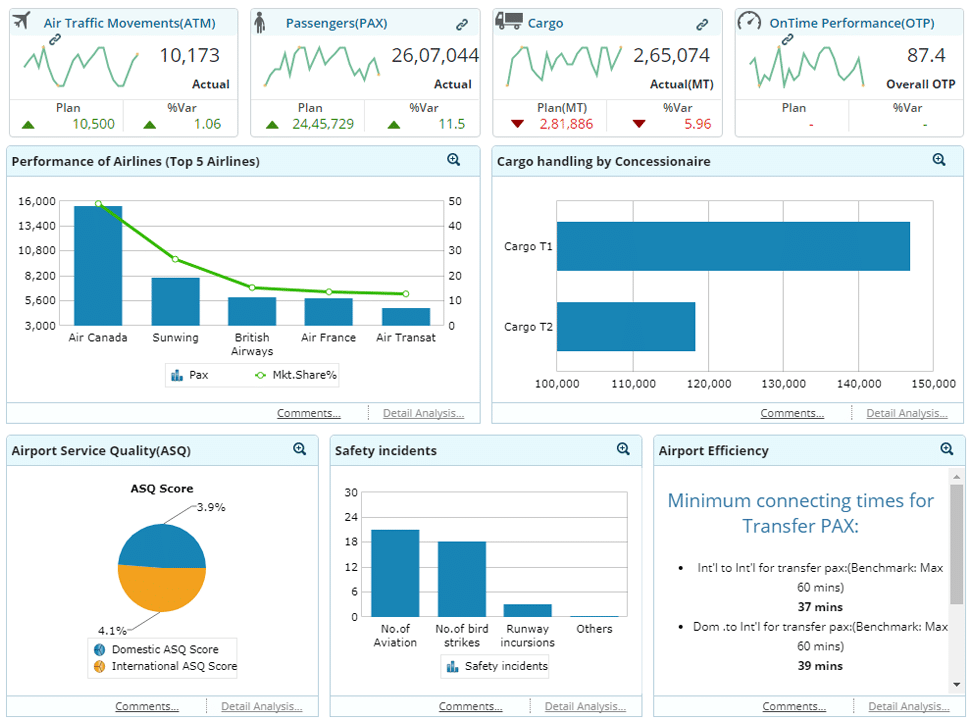
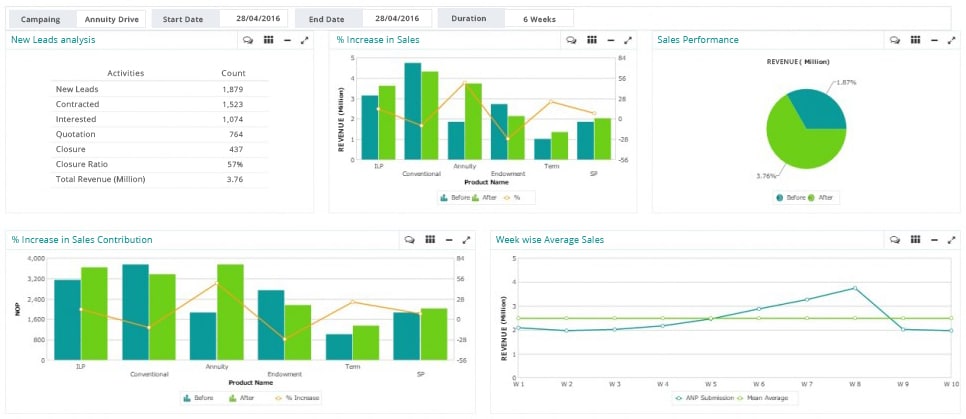
Domain-Specific Standard Templates
-
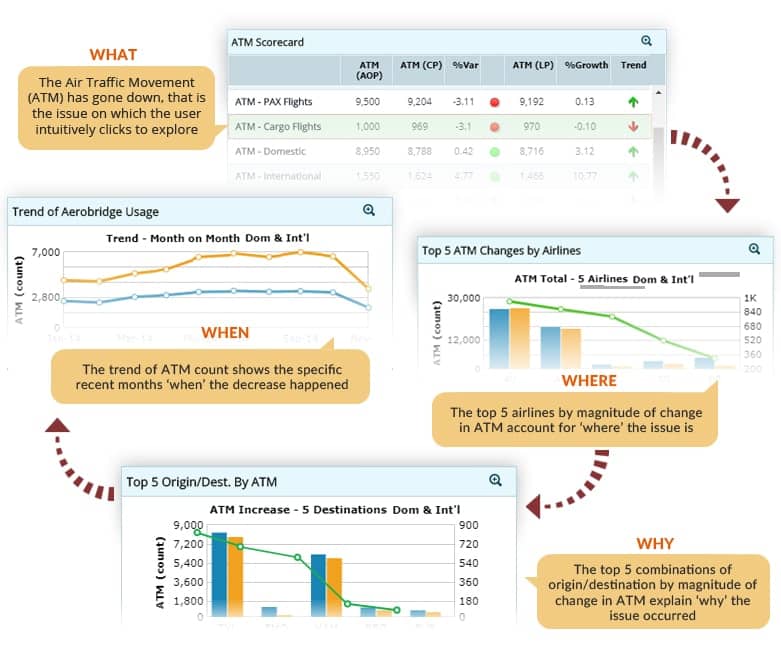
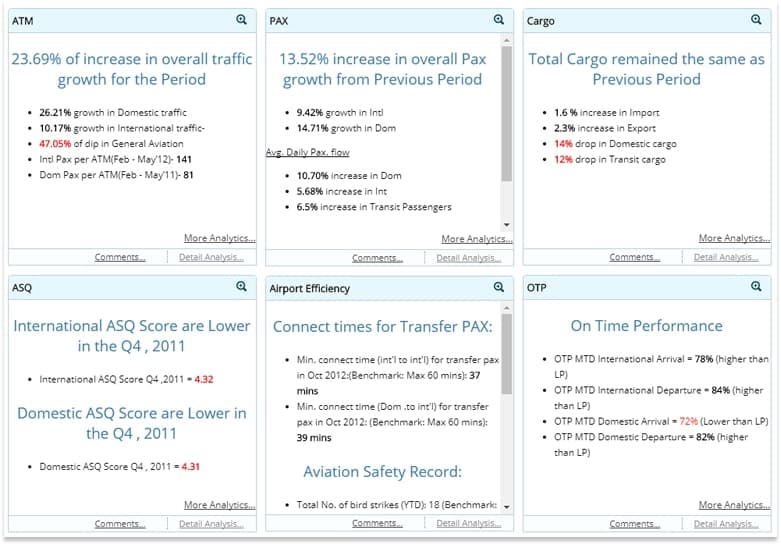
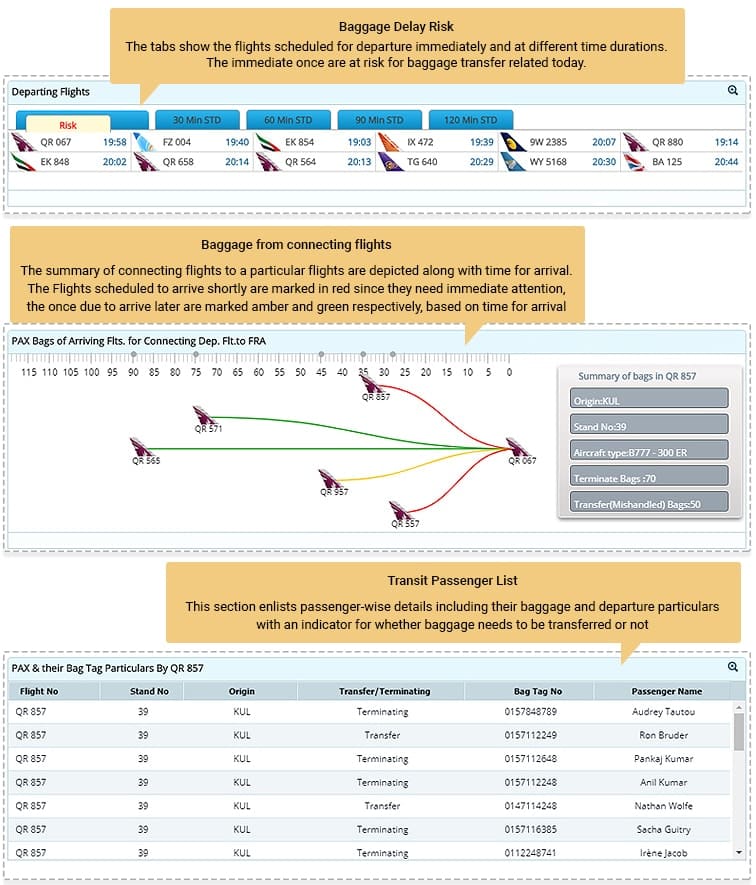
Intuitive, Problem-Solution driven navigation
-
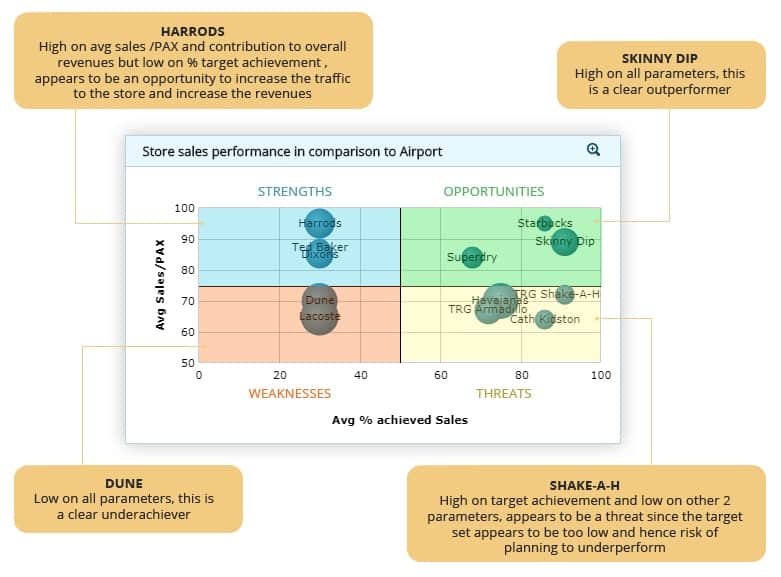
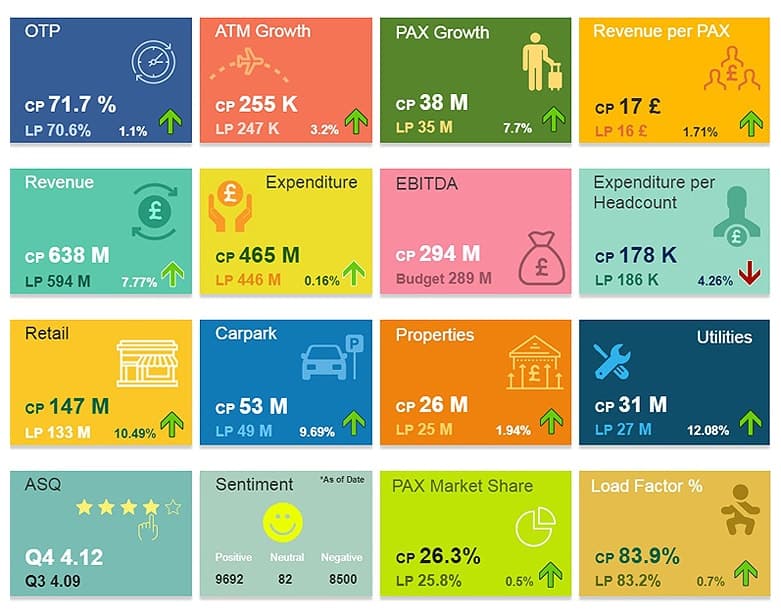
Uncluttered Visuals with Glance-Through Approach
- Seamless and Responsive UI Across Device

Role-Based Dashboards
Visualizations and KPI’s Delivered according to role of BI Consumer
CEO
COO
CFO
Head of Sales
Head of Quality
Marketing Manager
Operations Manager
HR Manager
Procurement Manager
Finance Manager
Role-Based Dashboards
Visualizations and KPI’s Delivered according to role of BI Consumer
CEO
COO
CFO
Head of Sales
Head of Quality
Marketing Manager
Operations Manager
HR Manager
Procurement Manager
Finance Manager
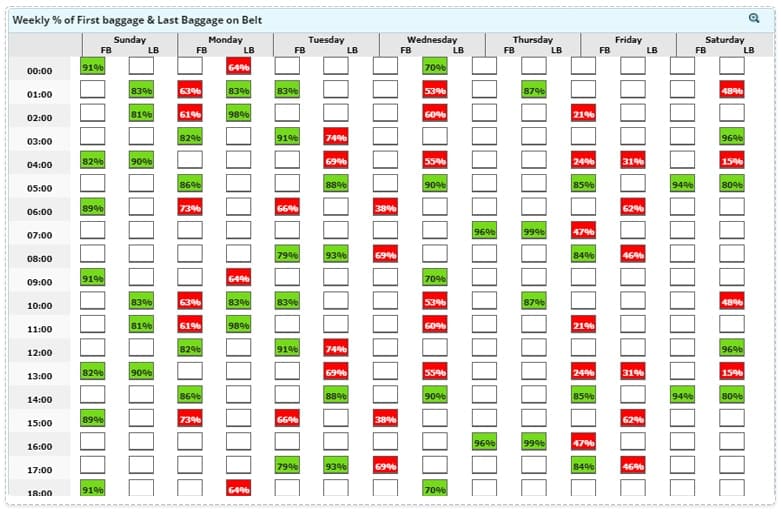
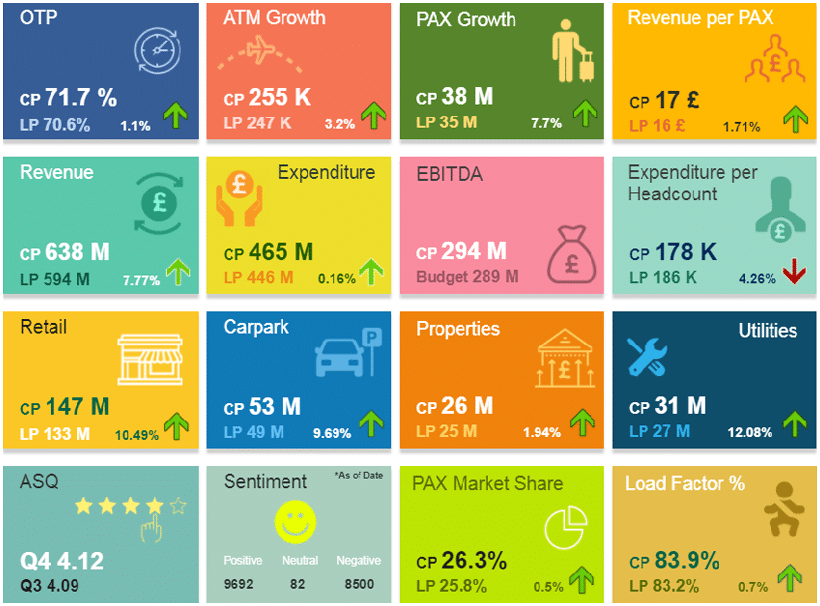
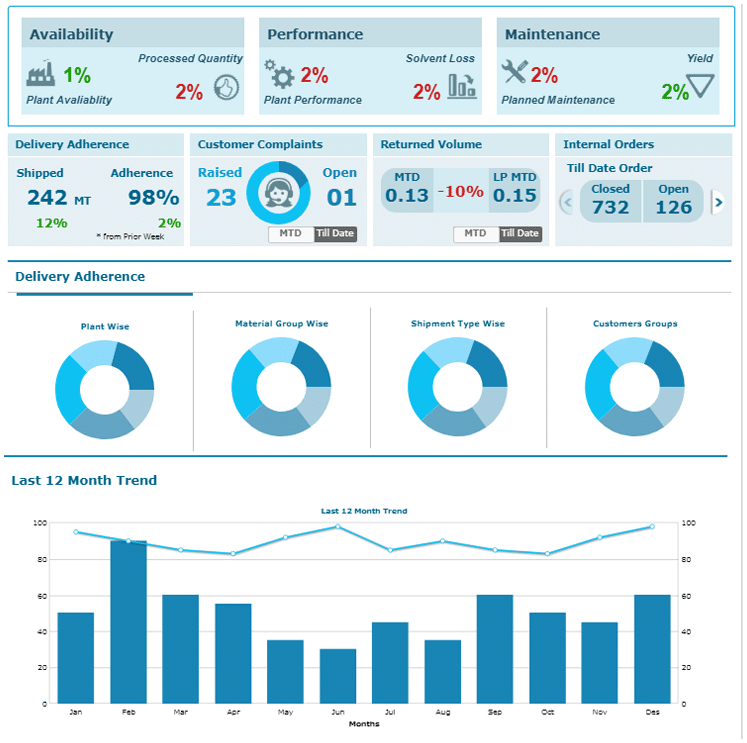
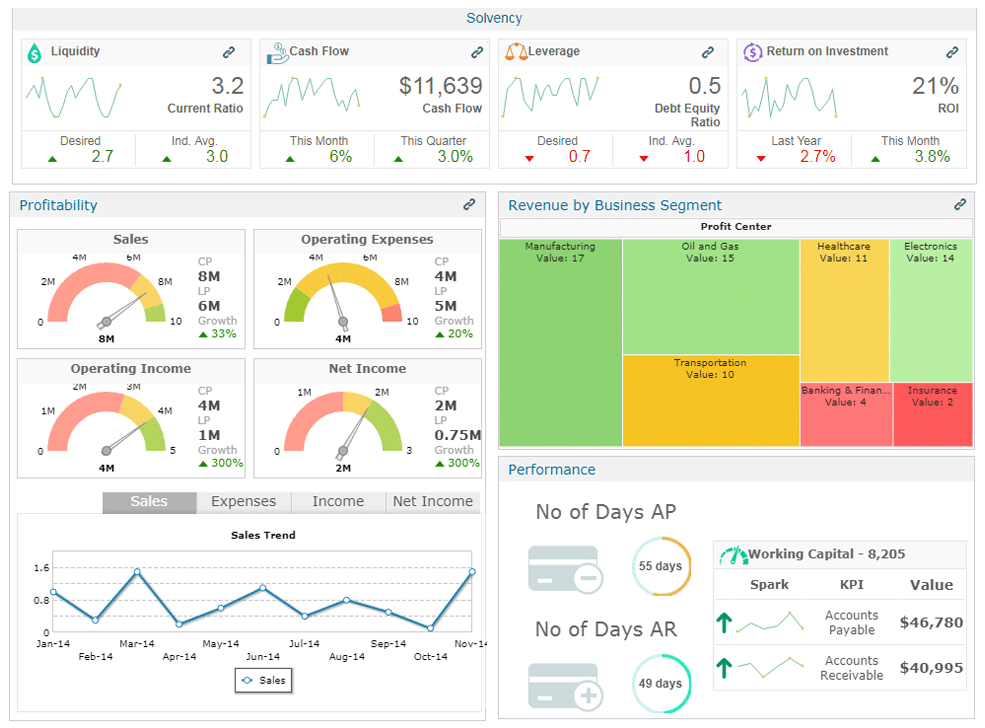
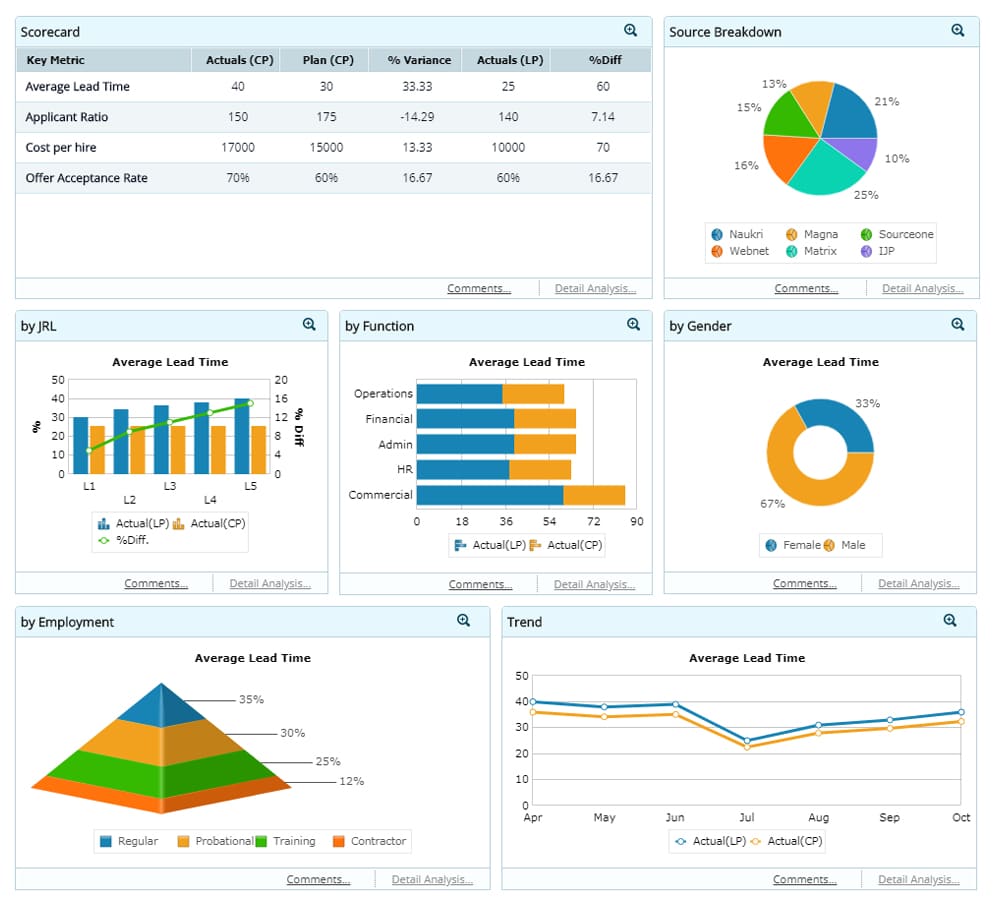
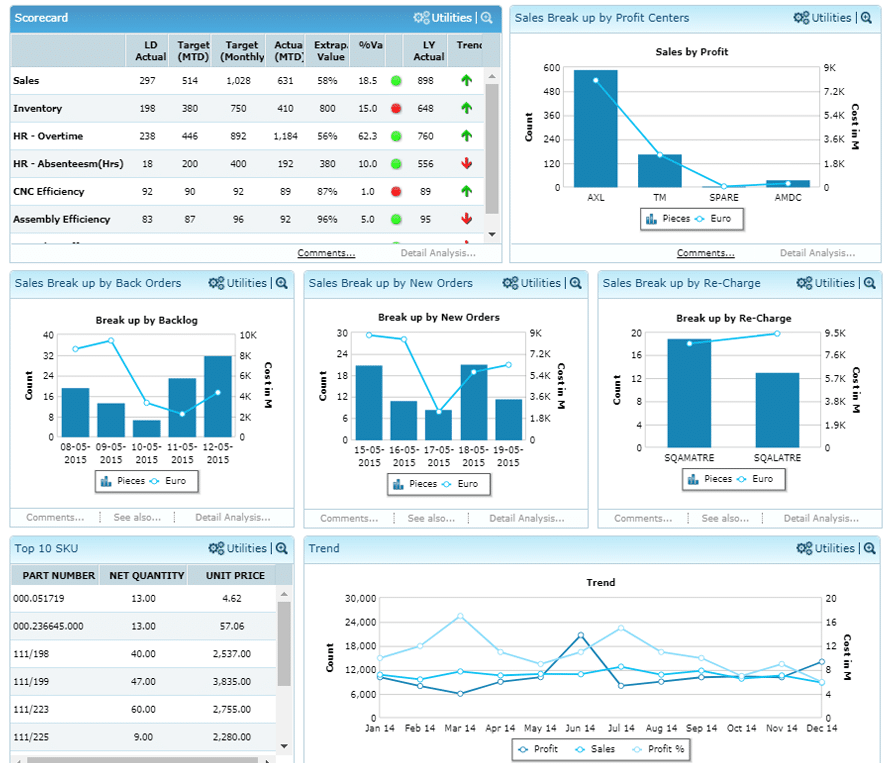
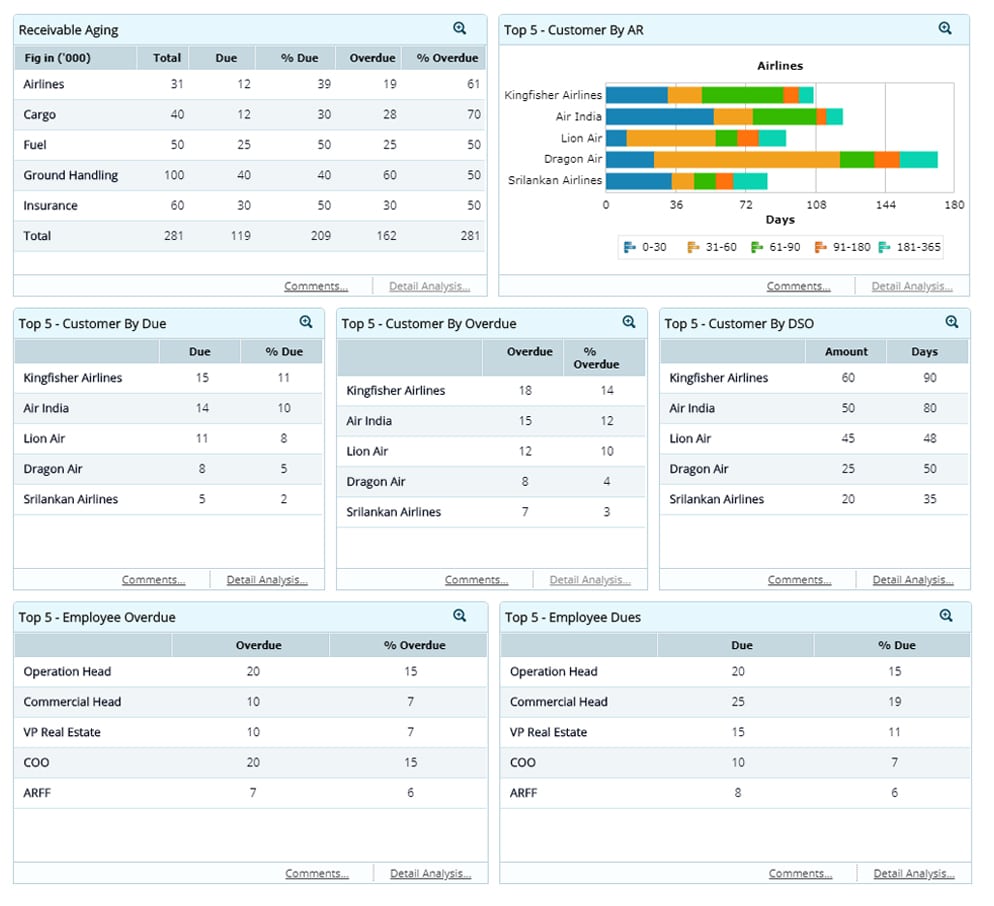
Visualization Library
Enlisted below are a set of visualization libraries used in GrayMatter’s dashboards that have been executed for marquee customers across the globe, across industries. The dashboards are seamlessly rendered across devices, making the premise of mobile bi dashboards very tangible and productive for key executives in the customer organization