
Pentaho Crosstab have been on the horizon for several years now. They lived a happy, undisturbed life along with the unicorns and gnomes guarding the pot of gold at the end of the rainbow. Penthao Crosstab are an easy and relatively easy way to visualize tabular data along two or more axis. They are an indispensable part of a modern report engine.
Although pentaho crosstab are still an experimental feature, and as such are not up to par with their counterparts in BO reports and the likes. They will not make it into 5.0.X as a stable feature, but even being experimental, they are already powerful enough to create some really useful reports.
How to create a Crosstab Report?
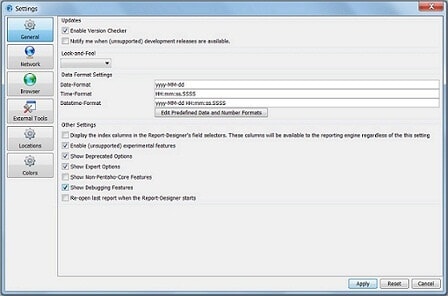
Step 1: In the report designer go to edit->Preferences. Here you need to enable the “Enable” (unsupported) experimental features
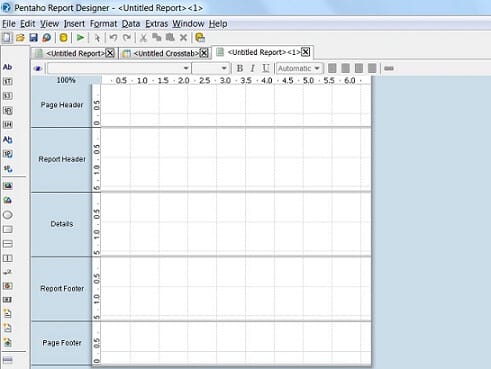
Step 2: Once clicked on ‘Apply’, you will be able to see the “crossTab” option in the left hand side features
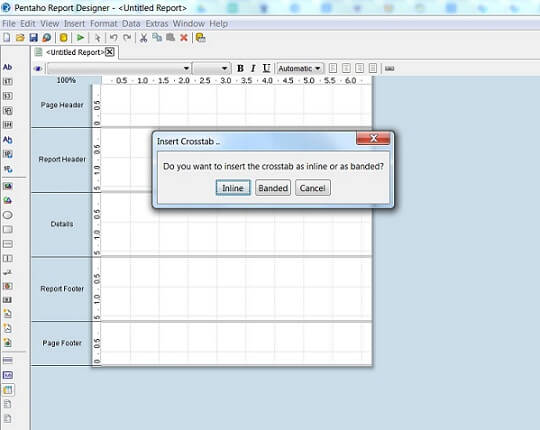
Step 3: Select, drag & drop the crosstab element into the reporting canvas. You can select the “Inline” or the “banded” option. Similar to Sub report.
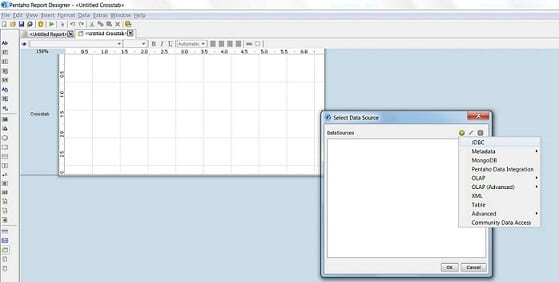
Step 4: Now, create the data source for required for the crosstab report.
Step 5: Once done, select the required fields at the appropriate places.
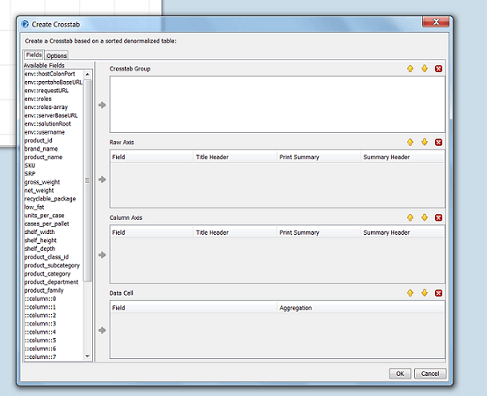
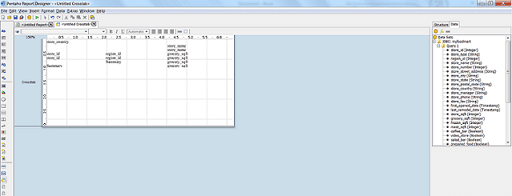
Step 6: The fields will be populated on the reporting canvas. We can now apply the formatting on the reporting fields for a better view of the report.
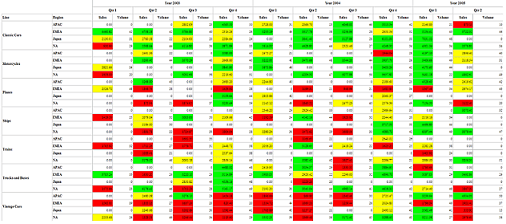
Sample report:
Benefits of Cross-Tabs
Cross-tabs deliver data in a familiar spreadsheet format. They also summarize both vertically and horizontally, have a grid format, and can change size depending on the data.
- Several of the most compelling reasons for using cross-tabs are
- Making better use of space
- Leveraging experience with the spreadsheet format
- Horizontal expansion
- Custom formatting
Because cross-tabs are grouped and summarized both vertically and horizontally, they are incredibly efficient at saving space as compared to a typical grouping report. They are very good at showing key information if the information required has at least two levels of grouping